Most banks operating in Poland have benefited from the improving economy and higher consumer confidence, being able to expand their balance sheets considerably. Total banking assets hit a record PLN 1.53 trillion as of December 2014, which corresponds to a 9% YoY growth rate. Total client deposits at banks recorded a 9% YoY increase to PLN 956 billion and total client lending rose by 6% to PLN 910 billion.
For more information on recent developments in the Polish banking sector, please refer to the full publication.
Table of contents
Slide 1: Executive summary
1. Macroeconomic overview Slide 2: Poland - General overview
Slide 3: Key macroeconomic indicators, 2008-2014
Slide 4: Foreign trade statistics, C/A balance, FDIs, 2008-2014
Slide 5: Unemployment and salaries, 2008-2014
Slide 6: Disposable income in households, 2008-2014; income distribution 2013
Slide 7: Consumer confidence Index evolution, 2009-1Q/2015
Slide 8: Warsaw Stock Exchange - Turnover, Market cap and indexes, 2008-2014
2.1. Banking market - General trends Slide 9: CEE banking markets: Size vs. growth matrix, 2012-2014
Slide 10: CEE banking penetration benchmarks - International comparison, 2014
Slide 11: Structure of the Polish Banking System, 2014
Slide 12: Polish Banking System ERA analysis, 1989-2015
Slide 13: Evolution of banking assets by groups of owners (domestic/foreign), 2002-2014
Slide 14: Top 10 foreign investors in the Polish banking market, 2014
Slide 15: Banking assets evolution (LCU, EUR), 2008-2014
Slide 16: Banking assets evolution by groups of banks, 2008-2014
Slide 17: Top 12 commercial banks, market shares, ownership, 2014
Slide 18: Evolution of market shares for top commercial banks, 2011-2014
Slide 19: Concentration of the banking market, 2013 /2014 (Assets, Branches, ATMs, HH Index)
Slide 20: Deposits by customer segment evolution, 2008-2014
Slide 21: Loans by customer segment evolution, 2008-2014
Slide 22: Foreign funding evolution, 2008-2014
Slide 23: Non-performing loans value and NPL ratios by type of business segment, 2009-Feb.2015
Slide 24: Non-performing retail loans, ratios by type of product, 2005-2014
2.2. Banking market - Regulatory overview Slide 25: Regulatory overview: Regulatory bodies in the Polish banking market
Slide 26: BFG - Deposit Insurance Fund
Slide 27: BIK - Credit Information Bureau
Slide 28: BIG - Regulated commercial/consumer information providers
Slide 29: Central Bank interest rates and mandatory reserve policy, 2000-2014
Slide 30: Inter-bank yield curves, 2010-2014 (WIBOR 3M, Polonia O/N)
Slide 31: Basel II/CRD implementation status, Capital requirement, own funds and CAR ratio for banks, 2009-2014
Slide 32: Consumer and mortgage lending – regulatory changes
2.3. Banking market - Banking Infrastructure Slide 33: Bank outlets by type of bank, 2008-2014
Slide 34: Employment in commercial banks, bank assets per employee evolution, 2008-2014
Slide 35: Direct employee costs evolution, 2009-2014
Slide 36: ATM number and transaction value evolution 2008-2014, ATM players, 2014
Slide 37: POS number and transaction value evolution 2008-2014, POS players, 2012
3. Retail banking Slide 38: Demographic trends determining future number of bank clients, 2007-2020F
Slide 39: Demographic and social trends influencing future number of bank accounts
Slide 40: Retail banking clients by segment - pyramid (mass market, affluent, personal and private banking), 2014
Slide 41: Households deposits by sub-segments, 2008-2014
Slide 42: Cash in circulation, cash vs. deposits ratio, 2008-2014
Slide 43: Household loans by sub-segments evolution, 2008-2014
Slide 44: TOP banks serving households sector, market shares, 2014
Slide 45: Deposits of private individuals, structure by currency, 2008-2014
Slide 46: Deposits of private individuals, structure by maturity, 2008-2014
Slide 47: Current account penetration in Poland, Bank account holders demography, 2012
Slide 48: Bank account penetration gap: Poland vs. Europe, 2014
Slide 49: Current accounts of individuals (ROR) at major banks, 2012-2014
Slide 50: Internet and PC penetration in Polish households and in corporate sector, shopping online, 2014
Slide 51: Number of accounts with online access and number of online accounts actively used, 2008-2014
Slide 52: Online Banking - new entrants: ING and Citibank and perspectives for standalone internet projects
Slide 53: Mobile Banking - availability of mobile account access , top banks and number of users, 2014
Slide 54: Innovation in payments – PKO IKO, BLIK, PeoPay, iKasa, SkyCash, mPay, Orange Cash, T-mobile , MyWallet , Visa V.me , etc.
Slide 55: Investment funds assets evolution, domestic and foreign funds, 2008-2014
Slide 56: Investment funds - top 10 players, 2014
Slide 57: Personal Financial Assets (PFA) structure and evolution, 2011-2014
Slide 58: Loans to private individuals by type evolution, 2008-2014
Slide 59: Mortgage to private individuals by currency evolution, 2008-2014
Slide 60: Mortgage to private individuals – new sales, outstanding contracts, 2008-2014
Slide 61: Consumer lending market, volumes and values, 2012-2014
Slide 62: Dedicated car loans market, 2009-2014
Slide 63: Financial intermediaries: Value and number of loans and investment products sold, 2013
3.1. Payment cards Slide 64: Cards issued by type, 2008-2014
Slide 65: Cards payments: Poland vs. Europe, Growth vs. market development, 2013
Slide 66: Cards payments: International comparison, Card payments value, volume, cards issued, 2013
Slide 67: Card transactions by type (cashless, cash), share of cash transactions, 2009-2014
Slide 68: Credit card transactions , values, volumes, per card evolution, 2009-2014
Slide 69: Top players in credit cards business, co-branding partners, 2014
4. Corporate banking Slide 70: Corporate subjects by size, number, employment, revenues and profits, 2013
Slide 71: Corporate subjects, revenue and profit evolution, 2008-2014
Slide 72: Number of firms by turnover (with 10+ employees), 2013
Slide 73: Corporate subjects, regional distribution, 2014
Slide 74: Corporate deposits and loans evolution, 2008-2014
Slide 75: Top players in the corporate banking market, market shares in deposits and loans , 2014
Slide 76: Brokerage business, top players, shares of investors groups, 2009-2014
Slide 77: Leasing market, structure by industry, top players, 2009-2014
Slide 78: Factoring market, top players, 2009-2014
Slide 79: Non-treasury debt securities market, 2009-2014
5. Banks' profitability Slide 80: Nominal rates on loans and deposits by segment, implied margins, 2011-Mar.2015
Slide 81: Commercial banks - profitability tree, 2011-2014
Slide 82: Commercial banks - revenue, costs and profits composition, 2014
Slide 83: Top 5 commercial banks profitability tree – peers comparison, 2014
Slide 84: Segment reporting (1/2): volumes, revenues and profit by segment (retail, corporate, other), 2014
Slide 85: Segment reporting (2/2): volumes, revenues and profit by segment (retail, corporate, other), 2014
6. Banks' valuation and M&A activity Slide 86: Share price performance in the stock market for key listed banks in Poland, 2013-2015
Slide 87: Market multiples for major listed banks in Poland, 3/2015
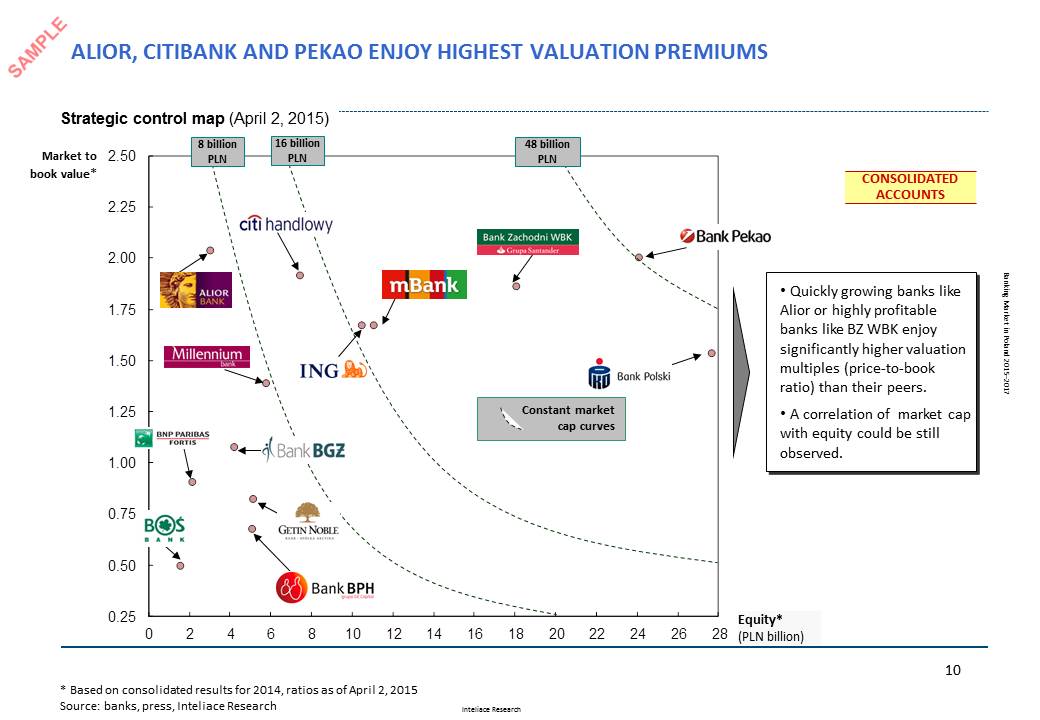
Slide 88: Strategic control map for major listed banks in Poland, Apr.2, 2015
Slide 89: Efficiency of top banks in Poland - Cost to income, Assets/Personnel/Branches benchmarks, 12/2014
Slide 90: Acquisition transactions in the Polish banking market (1/3), 2005-2008
Slide 91: Acquisition transactions in the Polish banking market (2/3), 2009-2011
Slide 92: Acquisition transactions in the Polish banking market (3/3), 2012-2015
Slide 93: New entrants, 2014-2014
Slide 94: Mergers in the Polish banking market, 2009-2014
Slide 95: Announced M&A deals – banks put on sale as of Q1 2015
7. Top 5 banks - Profiles Slide 96-97: Bank profiles: PKO Bank Polski
Slide 98-99: Bank profiles: Bank Pekao
Slide 100-101: Bank profiles: mBank
Slide 102-1043 Bank profiles: ING Bank Śląski
Slide 104-105: Bank profiles: BZ WBK
8. Mid-term forecasts Slide 106: Banking assets forecast, 2015-2017
Slide 107: Forecast – retail loans & retail deposits, 2015-2017
Slide 108: Forecast – corporate loans & corporate deposits, 2015-2017
9. Notes on methodology
 Research Report: "Banking market in Poland, 2015-2017"