Poland's economy accelerated in 2015 with Gross Domestic Product (GDP) advancing at 3.6% annual rate.
Banking volumes have continued to grow fast in course of 2015, reflecting favorable developments in the economy and higher consumer confidence.
Total banking assets hit a record PLN 1.6 trillion as of December 2015, which corresponds to a 4% YoY growth rate.
In our base-case scenario, we see Poland's economy remaining strong in 2016 but decelerating in 2017 and 2018. We assume a continued growth in key banking volumes, in particular in retail deposits and in corporate lending.
For more information on recent developments in the Polish banking sector, please refer to the full publication.
Table of contents
Slide 1: Executive summary
1. Macroeconomic overview
Slide 2: Poland - General overview
Slide 3: Poland vs. other consumer markets in Europe
Slide 4: Key macroeconomic indicators, 2010-2015
Slide 5: Foreign trade statistics, C/A balance, FDIs, 2010-2015
Slide 6: Unemployment, wages & salaries, 2010-2015
Slide 7: Disposable income in households, 2010-2015; income distribution 2014
Slide 8: Consumer confidence Index evolution, 2009-1Q/2015
Slide 9: Warsaw Stock Exchange - Turnover, Market cap and indexes, 2010-2015
2.1. Banking market - General trends
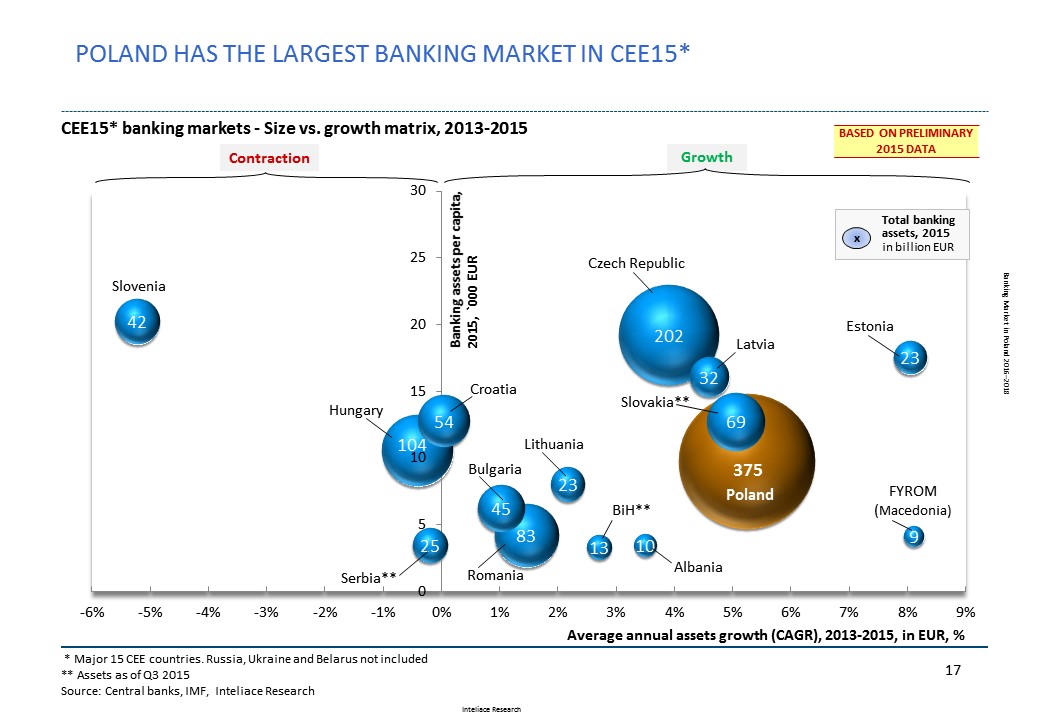
Slide 10: CEE banking markets: Size vs. growth matrix, 2013-2015
Slide 11: CEE banking penetration benchmarks - International comparison, 2015
Slide 12: Structure of the Polish Banking System, 2015
Slide 13: Polish Banking System ERA analysis, 1989-2015
Slide 14: Evolution of banking assets by groups of owners (domestic/foreign), 2002-2015
Slide 15: Top 10 foreign investors in the Polish banking market, 2015
Slide 16: Banking assets evolution (LCU, EUR), 2010-2015
Slide 17: Banking assets evolution by groups of banks, 2010-2015
Slide 18: Top 12 commercial banks, market shares, ownership, 2015
Slide 19: Evolution of market shares for top commercial banks, 2012-2015
Slide 20: Concentration of the banking market, 2015 /2014 (Assets, Branches, ATMs, HH Index)
Slide 21: Deposits of non-financial clients by segment, 2010-2015
Slide 22: Loans to non-financial clients by segment, 2010-2015
Slide 23: Deposits and loans of financial clients, 2010-2015
Slide 24: Foreign funding evolution, 2010-2015
Slide 25: Non-performing loans value and NPL ratios by type of business segment, 2009-Feb.2015
Slide 26: Non-performing retail loans, ratios by type of product, 2005-2014
2.2. Banking market - Regulatory overview
Slide 27: Regulatory overview: Regulatory bodies in the Polish banking market
Slide 28: BFG - Deposit Insurance Fund
Slide 29: BIK - Credit Information Bureau
Slide 30: Central Bank interest rates and mandatory reserve policy, 2000-2015
Slide 31: Inter-bank yield curves, 2010-2015 (WIBOR 3M, Polonia O/N)
Slide 32: Basel II/CRD implementation status, Capital requirement, own funds and CAR ratio for banks, 2009-2014
Slide 33: Consumer and mortgage lending – regulatory changes
Slide 34: Likely impact of new bank tax (tax on bank assets) on lending margins
2.3. Banking market - Banking Infrastructure
Slide 35: Bank outlets by type of bank, 2011-2016 (q1)
Slide 36: Employment in commercial banks, bank assets per employee evolution, 2010-2015
Slide 37: Direct employee costs evolution, 2010-2015
Slide 38: ATM number and transaction value evolution 2010-2015, ATM players, 2016 Q1
Slide 39: POS number and transaction value evolution 2010-2015, POS players, 2015 H1
3. Retail banking
Slide 40: Demographic trends determining future number of bank clients, 2015-2030F
Slide 41: Retail banking clients by segment - pyramid (mass market, affluent, personal and private banking), 2015
Slide 42: Cash in circulation, cash vs. deposits ratio, 2010-2015
Slide 43: Household deposits evolution, split local vs. foreign currency, 2010-2015
Slide 44: Household deposits by sub-segments, 2015
Slide 45: Household loans by sub-segments evolution, 2010-2015
Slide 46: TOP banks serving household sector, market shares, 2015
Slide 47: Current account penetration in Poland, Bank account holders demography, 2012
Slide 48: Bank account penetration gap: Poland vs. Europe, 2014
Slide 49: Current accounts of individuals (ROR) at major banks, 2013-2015
Slide 50: Internet use and Internet users in Poland, 2015
Slide 51: Number of accounts with online access and number of online accounts actively used, 2010-2015
Slide 52: Mobile devices and mobile banking, top banks and number of users, 2015
Slide 53: Innovation in payments – digital wallets /mobile payments: MasterPass, PayPal, Visa, PKO IKO, BLIK, PayU, SkyCash, mPay etc.
Slide 54: Investment funds assets evolution, domestic and foreign funds, 2010-2015
Slide 55: Investment funds - top 10 players, 2015
Slide 56: Personal Financial Assets (PFA) structure and evolution, 2012-2015
Slide 57: Loans to household sector by type, evolution, 2010-2015
Slide 58: Mortgage to household sector by currency, 2010-2015
Slide 59: Mortgage to household sector – new sales, outstanding contracts, 2010-2015
Slide 60: Consumer lending evolution, 2010-2015
Slide 61: Consumer lending – new loans, 2013-2015
Slide 62: Financial intermediaries: Value and number of loans sold, 2014
3.1. Payment cards
Slide 63: Cards issued by type, 2010-2015
Slide 64: Cards payments: Poland vs. Europe, growth vs. market development stage, 2014
Slide 65: Cards payments: International comparison, card payments value, volume, cards issued, 2014
Slide 66: Card transactions by type (cashless, cash), share of cash transactions, 2010-2015
Slide 67: Credit card transactions , values, volumes, per card evolution, 2010-2015
Slide 68: Top players in credit cards business, co-branding partners, 2015
4. Corporate banking
Slide 69: Corporate subjects by size, number, employment, revenues and profits, 2014
Slide 70: Corporate subjects, revenue and profit evolution, 2010-2015
Slide 71: Number of firms by turnover (with 10+ employees), 2014
Slide 72: Corporate subjects, regional distribution, 2015 Q3
Slide 73: Corporate deposits and loans evolution, 2010-2015
Slide 74: Top players in the corporate banking market, market shares in deposits and loans , 2015
Slide 75: Brokerage business, top players, shares of investors groups, 2010-2015
Slide 76: Leasing market, structure by industry, top players, 2010-2015
Slide 77: Factoring market, top players, 2010-2015
Slide 78: Non-treasury debt securities market, 2010-2015
5. Banks' profitability
Slide 79: Nominal rates on loans and deposits by segment, implied interest margins, 2012-2015
Slide 80: Commercial banks - profitability tree, 2012-2015
Slide 81: Commercial banks - revenue, costs and profits composition, 2015
Slide 82: Top 5 commercial banks profitability tree – peers comparison, 2015
Slide 83: Segment reporting (1/2): volumes, revenues and profit by segment (retail, corporate, other), 2015
Slide 84: Segment reporting (2/2): volumes, revenues and profit by segment (retail, corporate, other), 2015
6. Banks' valuation and M&A activity
Slide 85: Share price performance in the stock market for key listed banks in Poland, 2014-2016 Q1
Slide 86: Market multiples for major listed banks in Poland, 3/2016
Slide 87: Strategic control map for major listed banks in Poland, March 2016
Slide 88: Efficiency of top banks in Poland - Cost to income, Assets/Personnel/Branches benchmarks, 12/2015
Slide 89: Acquisition transactions in the Polish banking market (1/3), 2005-2008
Slide 90: Acquisition transactions in the Polish banking market (2/3), 2009-2011
Slide 91: Acquisition transactions in the Polish banking market (3/3), 2012-2016
Slide 92: New entrants, 2014-2015
7. Top 5 banks - Profiles
Slide 93-94: Bank profiles: PKO Bank Polski
Slide 95-96: Bank profiles: Bank Pekao
Slide 97-98: Bank profiles: mBank
Slide 99-100 Bank profiles: ING Bank Śląski
Slide 101-102: Bank profiles: BZ WBK
8. Mid-term forecasts
Slide 103: Banking assets forecast, 2016-2018
Slide 104: Forecast – household loans & deposits, 2016-2018
Slide 105: Forecast – corporate loans & deposits, 2016-2018
9. Notes on methodology
 Research Report: "Banking market in Poland, 2016-2018"