Investment funds and asset management market in Poland, edition 2016
Research report:Investment funds and asset management market in Poland, 2016

pdf file Investment funds and asset management market in Poland, 2016

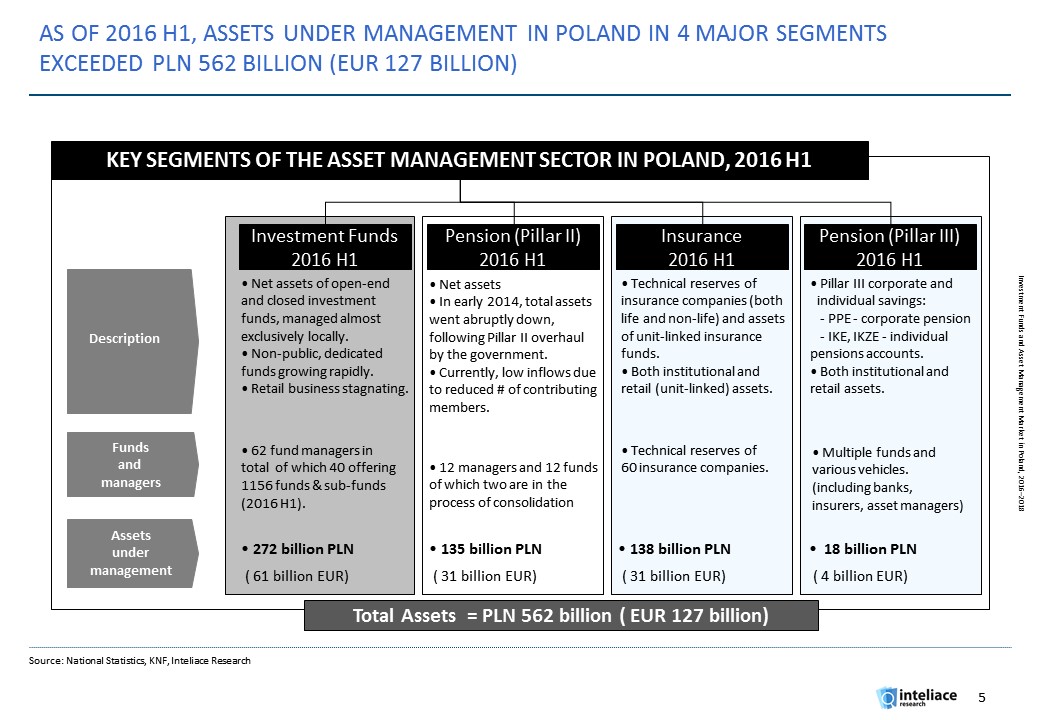
Total assets under management in Poland topped PLN 562 billion or EUR 127 billion across all key categories in H1 2016. The largest part of AM market are investment funds with assets of PLN 272 billion.

Outlook
The asset management sector in Poland is likely to see a further growth in assets under management thanks to increasing households' wealth and corporate savings. Assets are expected to increase across all segments, whereas the highest growth rates could be anticipated in the third pillar pension sector. Although, until recently, most of newly created personal wealth has ended up in investments in productive assets, in banks as deposits or in real estate, future trends are likely to change. Based on historical evidence of more advanced economies, a gradual increase of fund component in savings, could be expected. This will, however, require asset managers to adjust the offer of vehicles and investment strategies to address key issues like: weak local equity market, low efficiency and regulatory developments. Moreover, the current fragmentation in fund management business is unlikely to persist, in view of ongoing consolidation in banking and insurance sectors. Therefore a new wave of consolidation of fund managers is likely to take place. Fund managers will need to increase the scale of operations or they will be forced to quit.


--------------------------------------------------------------------------------------------------------------------------------------


Table of contents


1. Executive Summary
2. Asset Management Market
Slide 1: Asset management market in Poland - Key Segments, 2016 H1
Slide 2: Assets under management evolution, 2010-2016 H1
Slide 3: Top asset managers (groups) by AuM, 2016 H1
3. Investment Funds
Slide 4: CEE 8 Investment fund industry – size vs. growth matrix, 2014-2016 H1
Slide 5: CEE investment funds penetration benchmarks, 2016 H1
Slide 6: Evolution of assets, number of funds & managers 2010-2016 H1
Slide 7: Fund assets by type of fund 1/2, 2011-2016 H1
Slide 8: Fund assets by type of fund 2/2, 2011-2016 H1
Slide 9: Top players in investment fund market, 2016 H1
Slide 10: Market share evolution of top fund managers, 2012-2016 H1
Slide 11: Distribution channels for investment funds, 2016 H1
Slide 11: Investment fund assets flows, 2012 Q1-2016 Q2
Slide 12: Fund assets structure, 2016 H1
Slide 13: Ownership of funds by groups (retail/financial/other), 2010-2016 Q1
Slide 14: Local funds invested in foreign assets and foreign funds, 2016 H1
Slide 15: Assets of foreign funds, 2011-2016 H1
Slide 16: Fees and commissions charged by top fund managers, 2016 H1
Slide 17: Revenues and costs of fund managers, 2015
Slide 18: Profitability tree for fund managers, 2012-2015
Slide 19: Top players' profiles - Ipopema TFI
Slide 20: Top players' profiles - PZU TFI
Slide 21: Top players' profiles - PKO TFI
Slide 22: Top players' profiles - Pioneer Pekao TFI
Slide 23: Top players' profiles - Skarbiec TFI
Slide 24: M&A transactions including fund managers in Poland (2010-2015)
Slide 25: Upcoming or likely M&A transactions including fund managers
Slide 26: Product innovation - Absolute return funds
4. Pension
Slide 27: Pillar II: Sector evolution, 1998-2016
Slide 28: Pillar II: Assets, members, average account value, 2011-2016 H1
Slide 29: Pillar II: Asset managers, 2016 H1
Slide 30: Pillar II: Regulatory changes: New foreign investment limits
Slide 31: Pillar II: fund managers profitability tree, 2012-2015
Slide 32: Voluntary pension (Pillar III) - Assets, members, 2013-2016 H1
5. Insurance
Slide 33: Insurance assets by type evolution, 2011-2016 H1
Slide 34: Technical reserves by segment and by company, 2015
Slide 35: Profitability of life insurers, 2012-2015
Slide 36: Profitability of non-life insurers, 2016-2018
6. Forecasts
Slide 37: Asset Management Market: Mid-term forecast (investment fund assets, pension assets, insurance investments) 2016-2018
7. Notes on methodology
End of report.