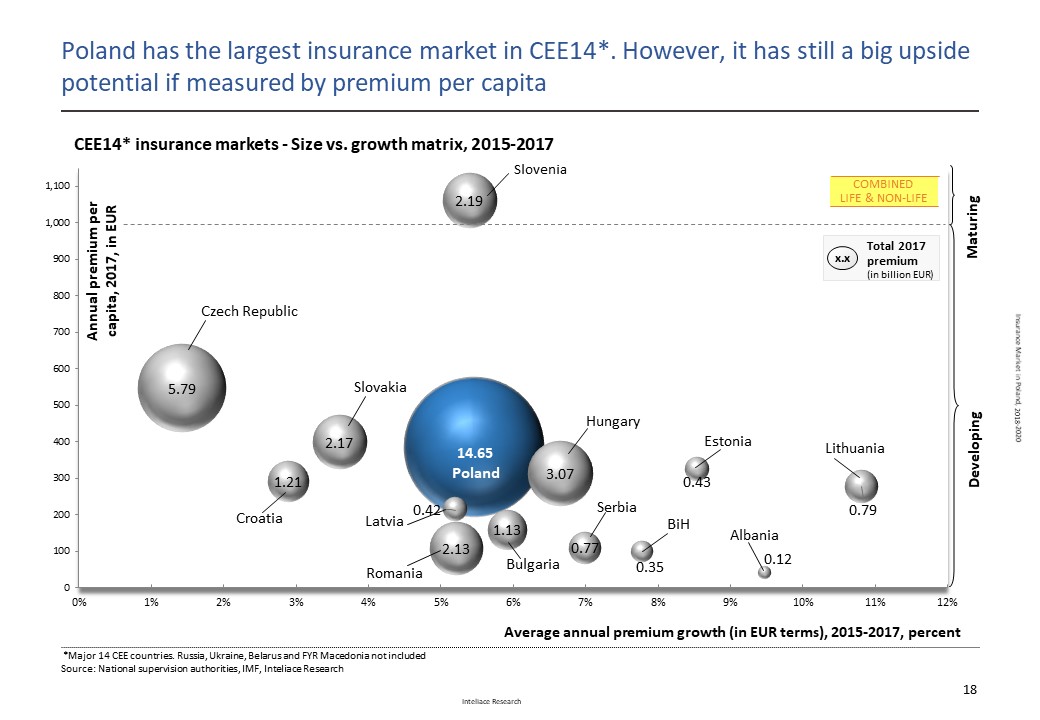
Poland has the largest insurance sector within the CEE with nearly € 15 billion in premium written p.a. and over 41% regional share in terms of GWP.
2017 was a good year for insurers operating in Poland. Premium written in non-life insurance surged by 18% YoY to nearly PLN 37.8 billion fuelled primarily by car insurance and benefiting from both higher tariffs and increasing number of insured cars. Also financial risks, health-related and property insurance sustained fast growth. By contrast, a remarkable reversal took place in the life insurance segment. After multiple years of declines, life insurance premium rebounded and started to grow again. This was possible thanks to much higher sales of unit-linked insurance – a result of multiple factors, including stronger equity markets and low interest rates at banks. Overall life insurance premium advanced by 3 %YoY and reached PLN 24.6 billion in 2017.
For more information on recent developments in the Polish insurance sector, please refer to the full publication.
Table of contents
Slide 1: Executive summary
1. Macroeconomic overview Slide 2: Poland - General overview
Slide 3: Poland in Europe: Number of households vs. wealth, 2016/2017
Slide 4: Key macroeconomic indicators, 2012-2017
Slide 5: Foreign trade statistics, C/A, FDI, 2012-2017
Slide 6: Unemployment and salaries/wages, 2012-2017
Slide 7: Disposable income in households and income distribution, 2012-2017; Income distribution 2016
Slide 8: Consumer confidence index evolution, 2011-Mar. 2018
Slide 9: Warsaw Stock Exchange - Turnover, Market cap. and indexes, 2012-2017
Slide 10: Banking assets evolution, 2012-2017
Slide 11: Top 12 foreign investors in banking sector and their subsidiaries, 2017
2. Insurance market Slide 12: Insurance Markets in CEE – Size vs. growth matrix, 2015-2017
Slide 13: Insurance premiums per capita & premiums/GDP penetration – CEE comparison, 2017
Slide 14: Insurance gross premiums - Local insurers (life/non-life, in EUR), 2013-2017
Slide 15: Insurance gross premiums - Local insurers (life/non-life, in PLN), 2013-2017
Slide 16: Top 12 insurance groups in Poland by total premium written, 2017
Slide 17: Insurance market concentration and Herfindahl-Hirschman Index (life/non-life), 2017 vs. 2016
Slide 18: Current and upcoming Insurance M&A transactions in Poland, 2018
Slide 19: Own funds for life and non-life insurers, 2013-2017, SCR coverage ratios, 2015-2017
Slide 20: Number of insurance agents by type and number of sales reps (OFWCA), 2013-2016
Slide 21: Insurance – Regulatory institutions, 2017
Slide 22: Private health Insurance – Opportunity for insurers; Premium written, 2015-2017
3. Non-life insurance Slide 23: Non-life insurance markets in CEE – Size vs. growth matrix, 2015-2017
Slide 24: Non-life premiums per capita & premiums/GDP penetration – CEE comparison, 2017
Slide 25: Non-life insurance gross and net premium evolution, 2013-2017
Slide 26: Top 10 non-life insurance players in Poland, 2017
Slide 27: Market shares of top non-life players evolution, 2014-2017
Slide 28: Non-life premium by client segment and insurance class (car insurance vs. other), 2017
Slide 29: Non-life premium by risk class, 2015-2017
Slide 30: Sales channels of non-life insurance, 2014-2016
Slide 31: Non-life insurers results, technical and P&L accounts (waterfall chart), 2017
Slide 32: Non-life insurance - Profitability tree, 2013-2017
Slide 33: Non-life insurance - Claims and expense ratio evolution, 2013-2017
Slide 34: Non-life insurance - Combined ratio and its elements, 2013-2017
Slide 35: Non-life insurance - Acquisition costs evolution, 2015-2017, acquisition cost ratios for top non-life insurers, 2016
Slide 36: Network multi-agents: Unilink, Consultia, CUK, Conditor, LGK etc.
Slide 37: Current legislative initiatives affecting insurance business in Poland, 2017/2018
Slide 38: Car insurance - Premium and no. policies evolution, MTPL, Casco, 2013-2017
Slide 39: Car insurance - Top players in MTPL and in Casco, 2015-2017
Slide 40: Car insurance - Combined ratio and its elements, MTPL and in Casco, 2015-2017
Slide 41: Car insurance - Average premium per policy for Casco and TPL, 1Q2013-4Q2017
Slide 42: Car insurance - Usage-based insurance: YU! – Yanosik Ubezpiecza, Link4 & NaviExpert, 2017
4. Life insurance Slide 43: Life insurance markets in CEE – Size vs. growth matrix, 2015-2017
Slide 44: Life premiums per capita & premiums/GDP penetration – CEE comparison, 2017
Slide 45: Life insurance gross and net premiums evolution, 2013-2017
Slide 46: Top 10 life insurance players in Poland, 2017
Slide 47: Market shares of top life players evolution, 2014-2017
Slide 48: Life premium by insurance class and segment, 2017
Slide 49: Life premium by risk class evolution, 2015-2017
Slide 50: Life insurance technical reserves evolution and structure, 2013-2017
Slide 51: Sales channels of life insurance, 2014-2016
Slide 52: Life insurers results, Technical and P&L accounts (waterfall chart), 2017
Slide 53: Life insurance - profitability tree, 2013-2017
Slide 54: Life insurance - acquisition costs evolution, 2015-2017, acquisition cost ratios for top life insurers, 2016
5. Bancassurance Slide 55: Bancassurance: Premium written by bank channel (life/non-life), 2014-2016 – data by KNF vs. data by PIU
Slide 56: Bancassurance: Product/class split in bank channel (life/non-life), 2017
Slide 57: Bancassurance: Sales of investment type life products other than unit-linked, 2013-2017
Slide 58: Bancassurance: Comparison websites and online sales sites of banks - overview
6. Top players' profiles Slide 59: Non-life insurance: PZU, 2015-2017
Slide 60: Non-life insurance: Ergo Hestia, 2015-2017
Slide 61: Non-life insurance: Warta, 2015-2017
Slide 62: Life Insurance: PZU Życie, 2015-2017
Slide 63: Life Insurance: Open Life, 2015-2017
Slide 64: Life Insurance: Aviva, 2015-2017
7. Forecast Slide 65: Non-life insurance premiums forecast, 2018-2020
Slide 66: Life Insurance premiums forecast, 2018-2020
Slide 67: Notes on Methodology
 Research Report: Insurance market in Poland, 2018-2020