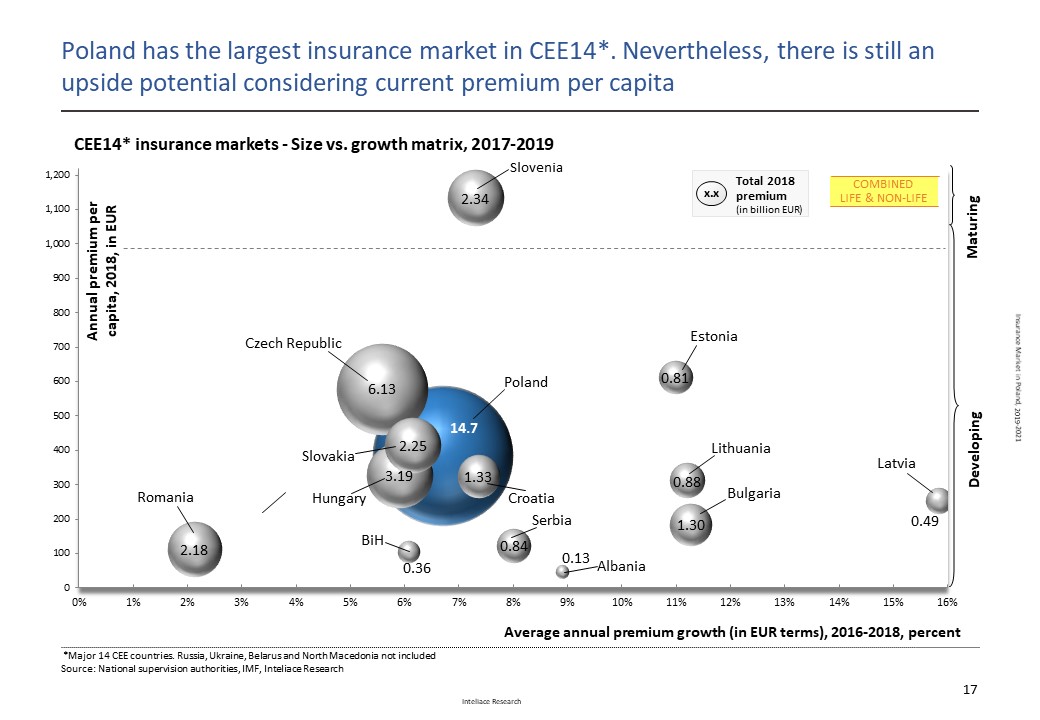
Poland has the largest insurance sector within the CEE with nearly €15 billion in premium written p.a. and almost 40% regional share in terms of GWP.
There are mixed trends observed in the insurance sector in Poland recently. While the non-life segment continues with a strong growth, the life insurance segment struggles with re-adjusting of product and service offering to the new regulatory regime.
Premium in the non-life segment jumped by 7% in 2018 and by 3% in 1H 2019, and it is expected to top PLN 42 billion by year end 2019. By contrast, the premium in the life segment continued to decline, falling by nearly 12% in 2018 and going down again by another 3% in 1H 2019.
For more information on recent developments in the Polish insurance sector, please refer to the full publication.
Table of contents
Slide 1: Executive summary
1. Macroeconomic overview Slide 2: Poland - General overview
Slide 3: Poland in Europe: Number of households vs. wealth, 2018
Slide 4: Key macroeconomic indicators, 2014-2019F
Slide 5: Foreign trade statistics, C/A, FDI, 2014-2019F
Slide 6: Unemployment and salaries/wages, 2014-2019F
Slide 7: Disposable income in households and income distribution, 2014-2019F; Income distribution 2018
Slide 8: Consumer confidence index evolution, Dec. 2013 – Nov. 2019
Slide 9: Warsaw Stock Exchange - Turnover, Market cap. and indexes, 2013-2018
Slide 10: Banking assets evolution, 2014-2019F
2. Insurance market Slide 11: Insurance Markets in CEE – Size vs. growth matrix, 2017-2019
Slide 12: Insurance premiums per capita & premiums/GDP penetration – CEE comparison, 2018
Slide 13: Insurance gross premiums - Local insurers (life/non-life, in EUR), 2015-2019F
Slide 14: Insurance gross premiums - Local insurers (life/non-life, in PLN), 2015-2019F
Slide 15: Top 12 insurance groups in Poland by total premium written, 1H 2019
Slide 16: Insurance market concentration and Herfindahl-Hirschman Index (life/non-life), 2017 vs. 1H 2019
Slide 17: Current and upcoming Insurance M&A transactions in Poland, 2019
Slide 18: Own funds for life and non-life insurers, 2015-1H 2019, SCR coverage ratios, 2016-2018
Slide 19: Number of insurance agents by type and number of sales reps (OFWCA), 2016-2018
Slide 20: Insurance – Regulatory institutions, 2019
Slide 21: Private health Insurance – Opportunity for insurers; Premium written, 2016-2019E
3. Non-life insurance Slide 22: Non-life insurance markets in CEE – Size vs. growth matrix, 2016-2018
Slide 23: Non-life premiums per capita & premiums/GDP penetration – CEE comparison, 2018
Slide 24: Non-life insurance gross and net premium evolution, 2015-2019F
Slide 25: Top 10 non-life insurance players in Poland, 1H 2019
Slide 26: Market shares of top non-life players evolution, 2016-1H 2019
Slide 27: Non-life premium by client segment and insurance class (car insurance vs. other), 1H 2019
Slide 28: Non-life premium by risk class, 2017-1H 2019
Slide 29: Sales channels of non-life insurance, 2017-2018
Slide 30: Non-life insurers results, technical and P&L accounts (waterfall chart), 2018
Slide 31: Non-life insurance - Profitability tree, 2015-1H 2019
Slide 32: Non-life insurance - Claims and expense ratio evolution, 2015-1H 2019
Slide 33: Non-life insurance - Combined ratio and its elements, 2015-1H 2019
Slide 34: Non-life insurance - Acquisition costs evolution, 2017-1H2019, acquisition cost ratios for top non-life insurers, 2018
Slide 35: Network multi-agents: Unilink, Consultia, CUK, Conditor, LGK etc.
Slide 36: Current legislative initiatives affecting insurance business in Poland, 2017/2019
Slide 37: Car insurance - Premium and no. policies evolution, MTPL, Casco, 2015-1H 2019
Slide 38: Car insurance - Top players in MTPL and in Casco, 2017-1H 2019
Slide 39: Car insurance - Combined ratio and its elements, MTPL and in Casco, 2017-1H 2019
Slide 40: Car insurance - Average premium per policy for Casco and TPL, 1Q2014-2Q2019
4. Life insurance Slide 41: Life insurance markets in CEE – Size vs. growth matrix, 2016-2018
Slide 42: Life premiums per capita & premiums/GDP penetration – CEE comparison, 2018
Slide 43: Life insurance gross and net premiums evolution, 2015-2019E
Slide 44: Top 10 life insurance players in Poland, 1H 2019
Slide 45: Market shares of top life players evolution, 2016-1H 2019
Slide 46: Life premium by insurance class and segment, 1H 2019
Slide 47: Life premium by risk class evolution, 2017-1H 2019
Slide 48: Life insurance technical reserves evolution and structure, 2016-1H 2019
Slide 49: Sales channels of life insurance, 2017-2018
Slide 50: Life insurers results, Technical and P&L accounts (waterfall chart), 2018
Slide 51: Life insurance - profitability tree, 2015-1H 2019
Slide 52: Life insurance - acquisition costs evolution, 2017-1H 2019, acquisition cost ratios for top life insurers, 2018
5. Bancassurance Slide 53: Bancassurance: Premium written by bank channel (life/non-life), 2016-2018, data by KNF vs. data by PIU
Slide 54: Bancassurance: Product/class split in bank channel (life/non-life), 3Q 2019
Slide 55: Bancassurance: Sales of investment type life products other than unit-linked, 2015-3Q 2019
Slide 56: Bancassurance: Comparison websites and online sales sites of banks – overview, 3Q 2019
6. Top players' profiles Slide 57: Non-life insurance: PZU TU, 2017-1H 2019
Slide 58: Non-life insurance: Ergo Hestia STU, 2017-1H 2019
Slide 59: Non-life insurance: Warta TUiR, 2017-1H 2019
Slide 60: Life Insurance: PZU Życie, 2017-1H 2019
Slide 61: Life Insurance: Aviva TUnŻ, 2017-1H 2019
Slide 62: Life Insurance: Nationale-Nederlanden TUnŻ, 2017-1H 2019
7. Forecast Slide 63: Non-life insurance premiums forecast, 2019-2021
Slide 64: Life Insurance premiums forecast, 2019-2021
Slide 65: Notes on Methodology
Slide 66: Life Insurance premiums forecast, 2018-2020
Slide 67: Notes on Methodology
 Research Report: Insurance market in Poland, 2019-2021