Research report: Mortgage lending in Poland, 2021

The residential construction in Poland remained hot in 2020 with home completions increasing by over 7% YoY and reaching a multi-year high at 222k. Nevertheless, there have been also first signs of stabilization with permits growing just by fraction and home starts falling slightly vs. 2019. At the same time, real estate prices continued to climb very fast, fuelled by more and more negative real interest rates and by accelerating CPI, which surpassed 4% in March 2021.
By contrast to real estate prices, mortgage lending cooled down slightly with new sales of mortgage loans decreasing by 10% and 3% YoY in terms of volume and value respectively in 2020. Slower sales of new mortgage on the growing real estate market could be attributed mostly to the impact of COVID-19 with lockdowns and stricter lending rules at banks. Nevertheless, mortgage lending is expected to rebound fast once the pandemics eases and it might hit new records already in 2021.
For more information on recent developments in the Polish banking sector, please refer to the full publication.
Table of contents
Executive summary
1. Residential real estate stock & prices
Slide 1: New dwellings completed, starts, permits, 2015-2020
Slide 2: New dwellings completed by regions, 2020
Slide 3: Residential real estate prices in key cities, 2015-2020 Q4
2. Mortgage lending
Slide 4: Total outstanding lending to households by type of loan, 2015-2020
Slide 5: Mortgage loans to households outstanding, local vs. foreign currency, 2015-2020
Slide 6: Number of new mortgage loans, value of new loans, average new loan size, 2015-2020
Slide 7: New sales of mortgage loans to individuals monthly/annual averages: 2017- Mar.2021
Slide 8: Distribution of new mortgage lending by top cities, 2020 Q4
Slide 9: Mortgage lending penetration benchmarks - International comparison, 2020 Q4
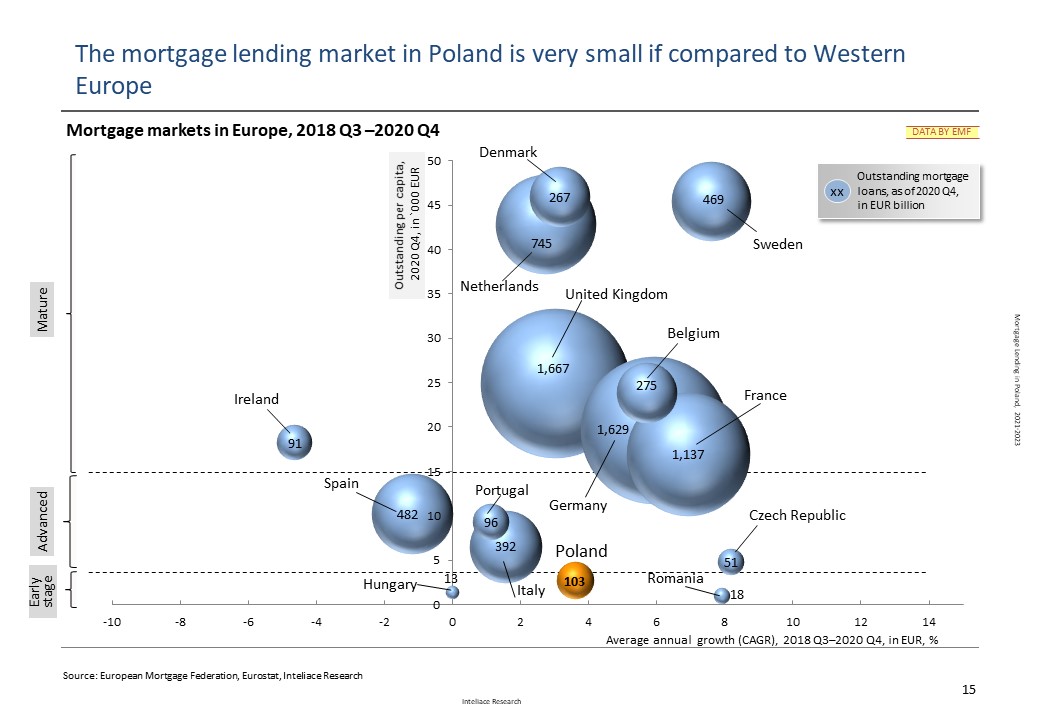
Slide 10: Mortgage lending in Poland vs. Europe- market size vs. growth, 2018 Q3-2020 Q4
Slide 11: New mortgage loans by size and LTV, 2016 Q1 - 2020 Q4
Slide 12: New mortgage loans by currency, 2015 Q1 - 2020 Q4
Slide 13: Top banks by outstanding mortgage loans (market share>5%) , 2018 Q3 - 2020 Q4
Slide 14: Reference rates: WIBOR3M & LIBOR CHF 6M, 2012-Mar.2021
Slide 15: Average lending margins evolution – PLN loans, 2012-Mar.2021
3. Regulatory issues, risk
Slide 16: The evolution of mortgage loan NPLs, 2012 Q1 - 2021 Q1
Slide 17: CHF/PLN exchange rate, 2005-Mar.2021, CHF-denominated loans outstanding.
4. Forecast
Slide 18: Mortgage loans – outstanding value forecast (PLN, FX loans), GDP penetration, 2021-2023
Methodological notes
End of report
 Research Report: "Mortgage lending in Poland, 2021-2023"