Investment funds and asset management market in Poland, edition 2023
Over the last five years, the asset management sector in Poland has experienced stagnation, characterized by temporary fluctuations but lacking substantial growth in managed assets. However, 2023 brought some relief, with total assets under management in key segments* reaching over PLN 700 billion in the third quarter of the year, compared to PLN 636 billion at the end of 2022. Investment funds remained the key asset group, surpassing PLN 304 billion, followed by second-pillar pension funds with PLN 179 billion and insurance companies' reserves at PLN 162 billion. The smallest segment, third-pillar pension funds, saw a surge to PLN 60 billion in assets under management, exhibiting the fastest growth among all categories.
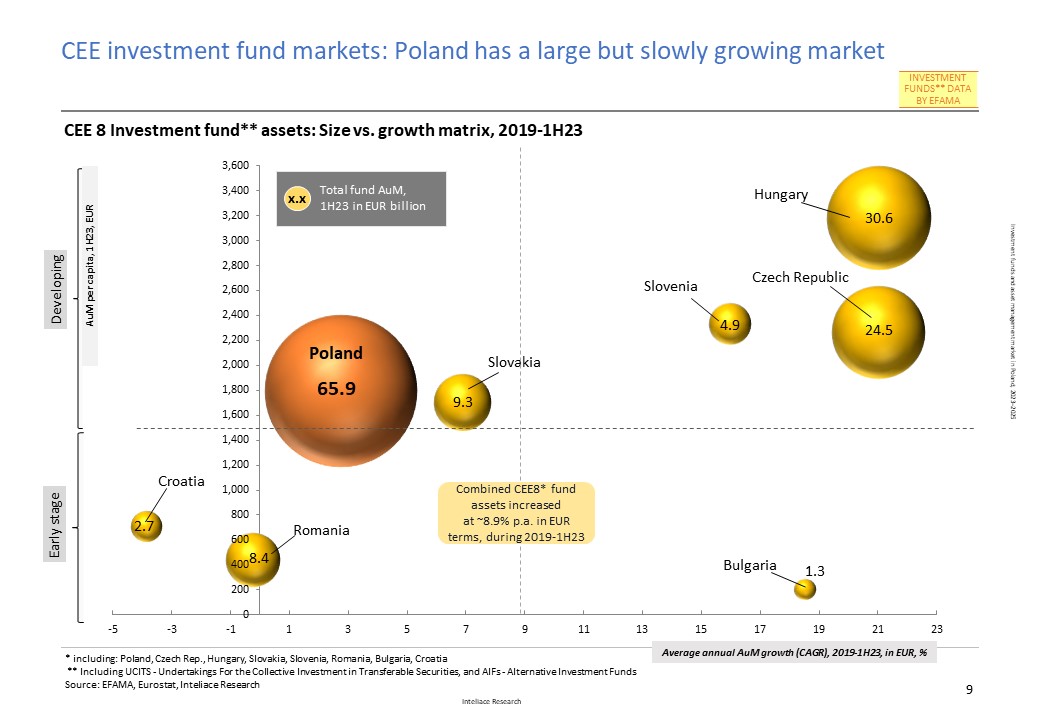
If compared to the other markets in the region, Poland has clearly the largest investment funds sector within the CEE. However, the value of managed assets has been growing slower than in most other CEE markets recently.Consequently, despite having the largest fund market by value, Poland is still behind a few peers in terms of assets value per capita or assets per unit of GDP.
The outlook
The total value of assets under management in Poland is anticipated to grow by over 40% between 2022 and 2025, marking the end of multi-year stagnation. High growth is expected in pension assets, particularly within the "new" third pillar (PPK).
*key categories included: Investment funds, Insurance assets, Pension assets (2nd and 3rd pillar); Excluded are bank and structured deposits, equities and bonds held directly
--------------------------------------------------------------------------------------------------------------------------------------
Table of contents
1. Executive Summary
2. Asset Management Market
Slide 1: Asset management market in Poland: Key Segments, 2Q/3Q 2023
Slide 2: Assets under management evolution, 2019-1H23
Slide 3: Top asset managers (groups) by AuM, 2Q/3Q 2023
3. Investment Funds
Slide 4: CEE 8 Investment fund industry – size vs. growth matrix, 2019-1H23
Slide 5: CEE investment funds penetration benchmarks, 1H23
Slide 6: Evolution of assets, number of funds & managers, 2018–3Q23
Slide 7: Fund assets by type of fund (open-end, closed), 2018–3Q23
Slide 8: Fund assets by underlying asset mix, 2020-3Q23
Slide 9: Fund assets by origin of assets (public/non-public assets), 2018–3Q23
Slide 10: Top 10 players in investment fund market, 3Q23
Slide 11: Market share evolution of top fund managers, 2020-3Q23
Slide 12: Top fund managers by client count, 3Q23
Slide 13: Distribution – online distribution platforms, 2023
Slide 14: Local funds invested in foreign assets and foreign funds, 3Q23
Slide 15: Investment fund assets flows, 1Q20-3Q23
Slide 16: Fund assets structure by: dominating asset class, dedication, geo- scope, open vs. closed, 3Q23
Slide 17: Ownership of funds by groups (retail/financial/other), 4Q19-2Q23
Slide 18: Structure of Personal Financial Assets (PFA). The share of Investment funds within savings of households, 2018-2Q23
Slide 19: Value of deposits, cash & investment funds held by households outstanding value, 2018-1H23
Slide 20: Fees and commissions charged by top fund managers, Nov. 23
Slide 21: Revenues and costs of fund managers, 2022
Slide 22: Profitability tree for fund managers, 2019-2022
Slide 23: Regulations: Fund management fee limitations
Slide 24: Top players' profiles - Ipopema TFI
Slide 25: Top players' profiles - PKO TFI
Slide 26: Top players' profiles - PZU TFI
Slide 27: Top players' profiles - Goldman Sachs TFI
Slide 28: Top players' profiles - Pekao TFI
Slide 29: M&A transactions including fund managers in Poland
4. Pension Funds
Slide 30: Composition of the pension sector (2nd and 3rd Pillar)
Slide 31: Pillar II: Assets, members, average account value, 2019–3Q23
Slide 32: Pillar II: Top pension asset managers (OFE), 3Q23
Slide 33: Pillar III - New pension vehicles: PPK overview (3rd pillar)
Slide 34: Pillar III - PPK: assets, members evolution, 2020-1H23
Slide 35: Pillar III - Summary, all products: assets, accounts, 2020-1H23
Slide 36: Pillar II: Managers (OFE) profitability tree, 2019-2022
5. Insurance Assets
Slide 37: Technical reserves by type evolution, 2019-2Q23
Slide 38: Technical reserves by segment and by company, 2022
Slide 39: Profitability of life insurers, 2018-2022
Slide 40: Profitability of non-life insurers, 2018-2022
6. Forecasts
Slide 41: Asset Management Market: Mid-term forecast for assets: investment fund assets, pension assets (p2, p3), insurance investments,
2023-2025
End of report.
 Investment funds and asset management market in Poland, 2023