Home › Reports › Investment funds
Investment funds and asset management market in Poland, 2019
Investment funds and asset management market in Poland, edition 2019
About this report
After the period of a very fast growth through 2017, total* assets under management in Poland decreased slightly to PLN 629 billion in H1 2019. The recently observed stagnation in total assets could be attributed to the weak performance of the local stock market. The recent correction affected mostly 2nd pillar pension funds, which by law have to overweight equities. Other segments remained relatively stable thanks to new contributions offsetting performance. As of June 2019, assets of regulated investment funds** reached PLN 293 billion, 3rd pillar pension assets exceeded PLN 25 billion and reserves of insurance companies remained almost unchanged at PLN 149*** billion. The asset management market remained medium-concentrated with top four groups: PZU, Aviva, NN and Ipopema managing roughly half of all assets in the market Outlook Assets under management in Poland are expected to sustain growth through 2021 while the most action is likely to take place within 3rd pillar pension funds. The new legal framework, in force since mid-2019, has mandated employers to enrol their employees and to match employee contributions. A further boost to 3rd pillar assets could be supplied by the final dismantling of 2nd pillar pension funds, although it would be initially a zero sum game or even a negative event for the sector as a whole
* Across key categories: Investment funds, Insurance assets, Pension assets (2nd and 3rd pillar) ** Funds tracked by IZFiA *** Technical reserves of non-life and life insurers, including unit-linked life funds
Table of contents
More on investment funds
See all →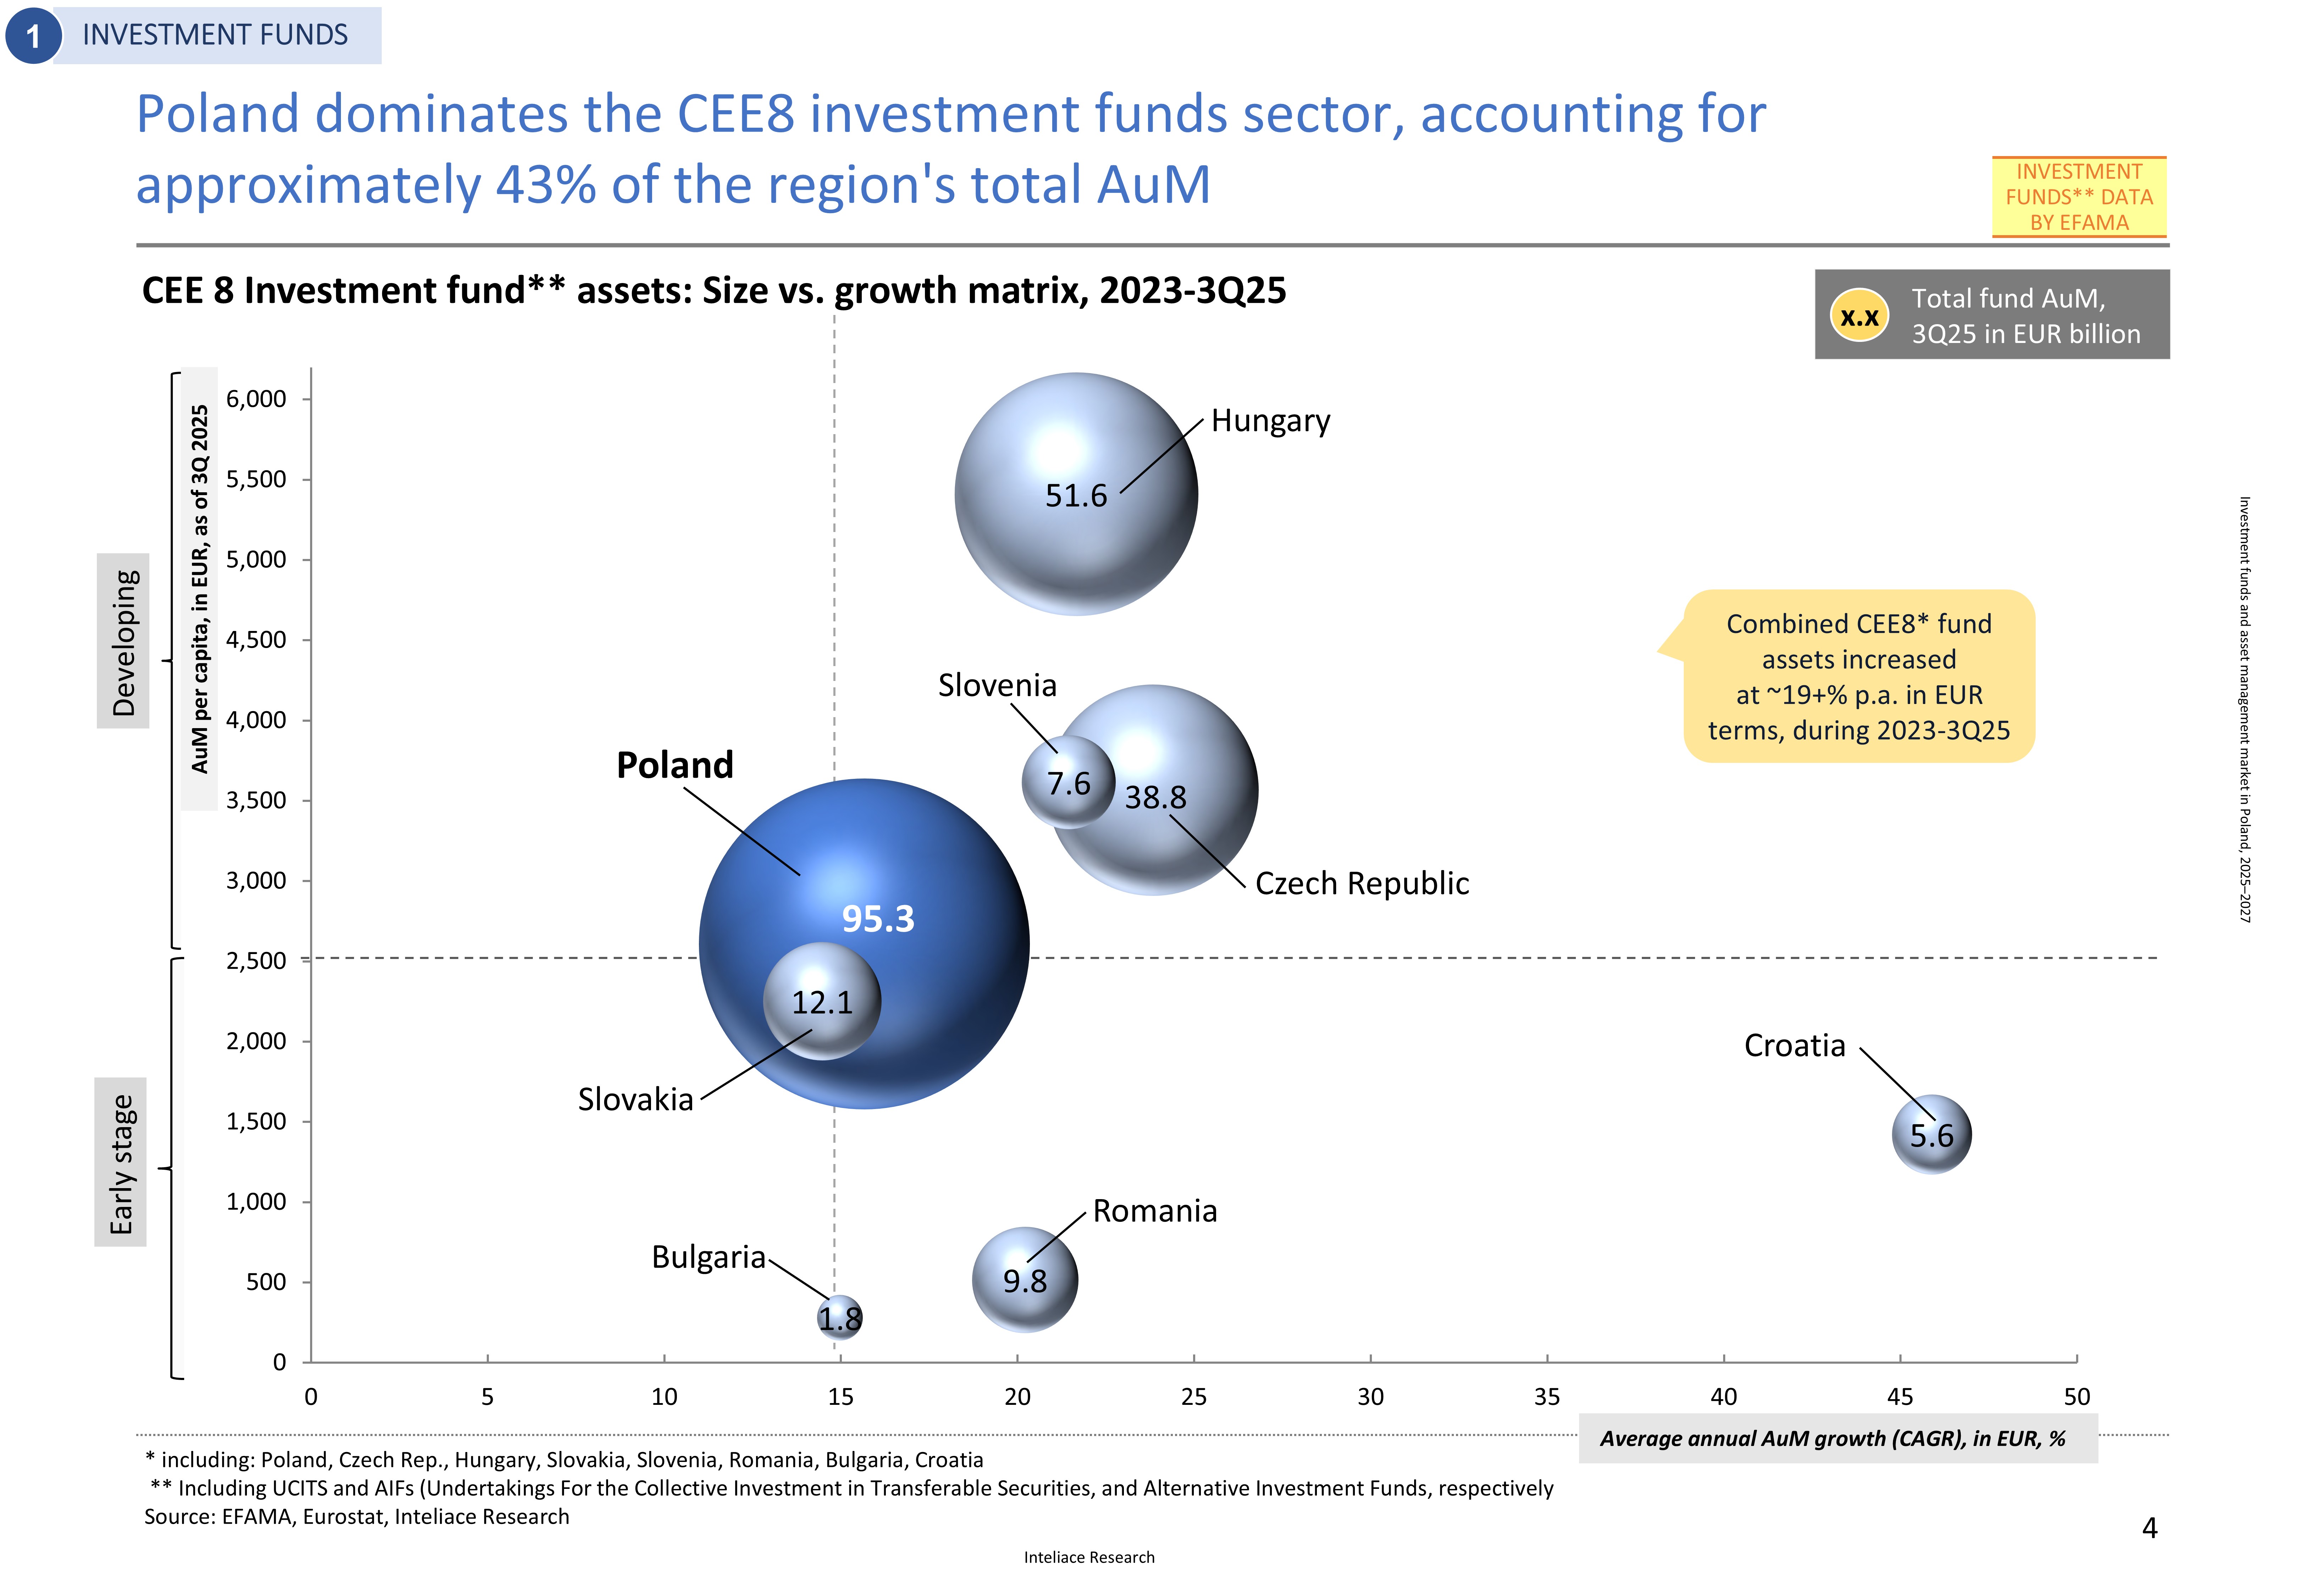
Investment funds and asset management market in Poland, 2025
In recent years, the asset management sector in Poland has demonstrated healthy growth, recovering from the contraction observed in 2022. All key market segments* have experienced consistent expansion, leading to a combined total of PLN 907 billion (EUR 214 billion) in assets under management (AuM) by Q2/Q3 2025. Investment funds remain the dominant segment, with AuM of PLN 390 billion, followed by second-pillar pension funds (OFE) at PLN 270 billion and insurance companies’ reserves at PLN 180 billion.
Investment funds and asset management market in Poland, 2024
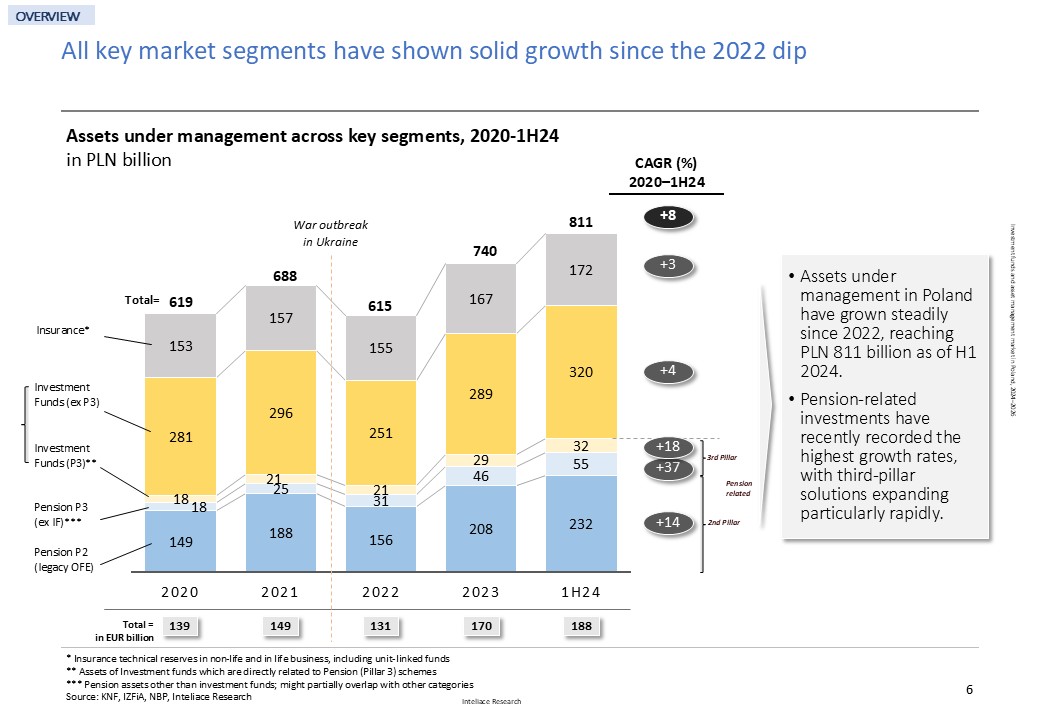
Over the past two years, the asset management sector in Poland has shown healthy growth, recovering from the contraction seen in 2022 due to geopolitical tensions following the outbreak of the war in Ukraine. Since late 2022, all key market segments have experienced consistent expansion, leading to a combined total* of PLN 811 billion (EUR 188 billion) in assets under management (AuM) by the first half of 2024. Investment funds remain the dominant segment, with AuM of PLN 352 billion, followed by second-pillar pension funds (OFE) at PLN 232 billion, and insurance companies’ reserves at PLN 172 billion. The most dynamic growth has been observed in third-pillar pension funds, which reported a remarkable increase in AuM, reaching PLN 55 billion (excluding PPK) as of June 2024. Market leadership in the asset management industry is concentrated among a few key players. PZU holds the leading position, managing PLN 163 billion in assets and capturing a 21% market share. Allianz follows with AuM of PLN 97 billion and a 13% share. Two mid-tier players, Nationale Nederlanden and PKO, each command approximately 9% of the market. Collectively, the top four players account for over 52% of the total market share, highlighting the fairly consolidated nature of the industry. Poland has the largest investment funds sector in Central and Eastern Europe, with over 86 billion EUR in assets under management (AuM). Recently, the growth of fund assets in Poland has accelerated, and the country's share of the region's AuM exceeded 45% in 3Q 2024. However, despite having the highest market value, Poland still lags behind some of its peers in terms of asset value per capita and assets relative to GDP. The outlook The asset management market, which includes three main segments—investment funds, insurance reserves, and pension assets—is expected to grow by more than 25% between the first half of 2024 and 2026. By December 2026, total assets under management (AuM) are projected to exceed PLN 1 trillion, with particularly strong growth anticipated for pension assets. *key categories included: Investment funds, Insurance assets, Pension assets (2nd and 3rd pillar); Excluded are bank and structured deposits, equities, and bonds held directly --------------------------------------------------------------------------------------------------------------------------------------
Investment funds and asset management market in Poland, 2023
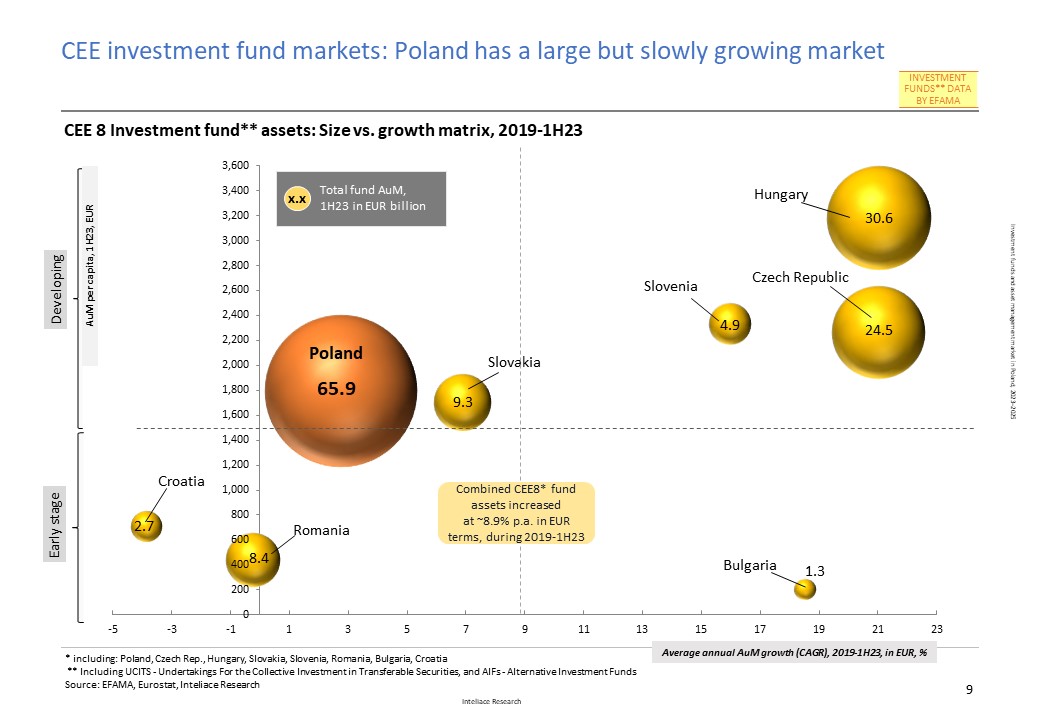
Over the last five years, the asset management sector in Poland has experienced stagnation, characterized by temporary fluctuations but lacking substantial growth in managed assets. However, 2023 brought some relief, with total assets under management in key segments* reaching over PLN 700 billion in the third quarter of the year, compared to PLN 636 billion at the end of 2022. Investment funds remained the key asset group, surpassing PLN 304 billion, followed by second-pillar pension funds with PLN 179 billion and insurance companies' reserves at PLN 162 billion. The smallest segment, third-pillar pension funds, saw a surge to PLN 60 billion in assets under management, exhibiting the fastest growth among all categories. If compared to the other markets in the region, Poland has clearly the largest investment funds sector within the CEE. However, the value of managed assets has been growing slower than in most other CEE markets recently.Consequently, despite having the largest fund market by value, Poland is still behind a few peers in terms of assets value per capita or assets per unit of GDP. The outlook The total value of assets under management in Poland is anticipated to grow by over 40% between 2022 and 2025, marking the end of multi-year stagnation. High growth is expected in pension assets, particularly within the "new" third pillar (PPK). *key categories included: Investment funds, Insurance assets, Pension assets (2nd and 3rd pillar); Excluded are bank and structured deposits, equities and bonds held directly --------------------------------------------------------------------------------------------------------------------------------------