Residential construction in Poland sustained fast growth in 2019. The number of completions surged by nearly 12%, while the number of starts jumped by almost 7% in 2019. Recently, residential real estate has become increasingly popular among investots due to growing rents and a higher demand for rental properties. The boom is reflected in growing valuations, in particular, across large cities where prices are at multi-year highs. The growth in demand for real estate is also fuelled by negative real interest rates, which discourage individuals from holding bank deposits and which promote material investments, offering preservation of purchasing power.
Mortgage lending accelerated in 2019. Sales of new contracts surged to over PLN 62 billon (EUR 14+ billion).
Looking forward, in our base scenario, we expect new mortgage lending to cool-off slightly in 2020 but then to resume the solid growth in 2021 and 2022.
For more information on recent developments in the Polish banking sector, please refer to the full publication.
Table of contents
Executive summary
1. Residential real estate stock & prices Slide 1: New dwellings completed, starts, permits, 2014-2019
Slide 2: New dwellings completed by regions, 2019
Slide 3: Residential real estate prices in key cities, 2013-2019 Q3
2. Mortgage lending Slide 4: Total outstanding lending to households by type of loan, 2014-2019
Slide 5: Mortgage loans to households outstanding, local vs. foreign currency, 2014-2019
Slide 6: Number of new mortgage loans, value of new loans, average new loan size, 2014-2019
Slide 7: New sales of mortgage loans to individuals monthly/annual averages: 2015-2019
Slide 8: Distribution of new mortgage lending by top cities, 2019 Q3
Slide 9: Mortgage lending penetration benchmarks - International comparison, 2019 Q3
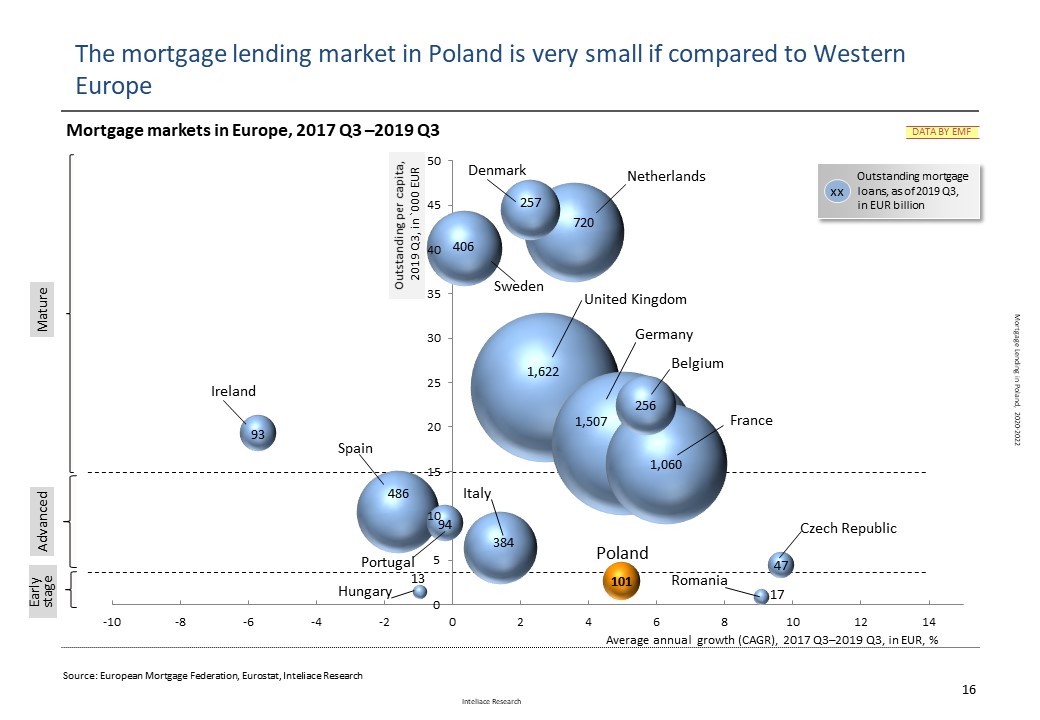
Slide 10: Mortgage lending in Poland vs. Europe- market size vs. growth, 2017 Q3-2019 Q3
Slide 11: New mortgage loans by size and LTV, 2015 Q1 - 2019 Q3
Slide 12: New mortgage loans by currency, 2015 Q1 - 2019 Q3
Slide 13: Top banks by outstanding mortgage loans (market share>5%) , 2017Q3, 2018 Q3, 2019 Q3
Slide 14: The role of financial intermediaries in mortgage loans distribution, 2014-2018
Slide 15: Reference rates: WIBOR3M & LIBOR CHF 6M, 2012-2019
Slide 16: Average lending margins evolution – PLN loans, 2012-2019
3. Regulatory issues, risk Slide 17: The evolution of mortgage loan NPLs, 2013 Q1 - 2019 Q3
Slide 18: Regulatory environment with regards to mortgage loans
Slide 19: CHF/PLN exchange rate, 2005-2019, CHF-denominated loans outstanding.
4. Forecast Slide 20: Mortgage loans – outstanding value forecast (PLN, FX loans), GDP penetration, 2020-2022
Methodological notes
 Research Report: "Mortgage lending in Poland, 2020-2022"