Residential construction in Poland accelerated again in 2017 extending growth trends observed since 2014. While the number of completions jumped by 9%, the number of new permits surged by nearly 18% in 2017 alone. The key driving forces of new residential construction remained unchanged. Stable, record-low interest rates and rising purchasing power of individuals fuel new purchases. Moreover, real estate investments have been increasingly popular in view of growing residential rents and due to low opportunity cost of holding cash or deposits.
After multiple years of stagnation mortgage lending has seen some recovery during 2017. Sales of new mortgage loans increased by 5% and 11% in terms of volume and value respectively, which also reflected growing average loan ticket size.
Looking forward, in our base scenario, we expect new mortgage lending to keep growing at moderate rates through 2020. The total outstanding is likely to increase by 5% p.a.
For more information on recent developments in the Polish banking sector, please refer to the full publication.
Table of contents
Executive summary
1. Residential real estate stock & prices Slide 1: New dwellings completed, starts, permits, 2012-2017
Slide 2: New dwellings completed by regions, 2017 Q1-Q3
Slide 3: Residential real estate prices in key cities, 2012-2017 Q3
2. Mortgage lending Slide 4: Total lending to households by type of loan, 2012-2017
Slide 5: Mortgage loans to households, local vs. foreign currency, 2012-2017
Slide 6: Number of new mortgage loans, average loan size, value of new loans, 2012-2017e
Slide 7: Distribution of new mortgage lending by top cities, 2017 Q2
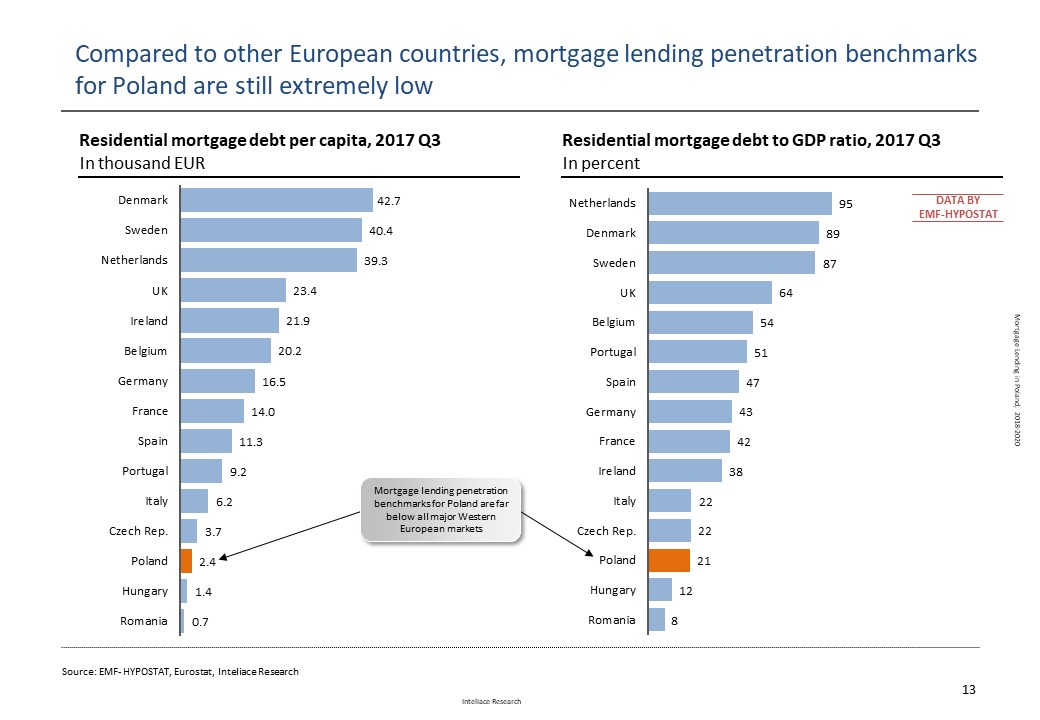
Slide 8: Mortgage lending penetration benchmarks - International comparison, 2017 Q3
Slide 9: Mortgage lending in Poland vs. Europe- market size vs. growth, 2015 Q3-2017 Q3
Slide 10: New mortgage loans by size and LTV, 2014 Q1 - 2017 Q3
Slide 11: New mortgage loans by currency, 2012 Q1 - 2017 Q3
Slide 12: Top players (market share>5%) on the mortgage loans market, 2016Q3 – 2017 Q3
Slide 13: The role of financial intermediaries in mortgage loans distribution, 2012-2016
Slide 14: Reference rates: WIBOR3M & LIBOR CHF 6M, 2012-2017
Slide 15: Average lending margins evolution – PLN loans, 2012-2017
3. Regulatory issues, risk Slide 16: The evolution of mortgage loan NPLs, 2009 Q1 - 2017 Q3
Slide 17: Regulatory environment with regards to mortgage loans
Slide 18: CHF/PLN exchange rate, 2005-2017, CHF-denominated loans outstanding.
4. Forecast Slide 19: Mortgage loans – outstanding value forecast and GDP penetration, 2018-2020
Methodological notes
 Research Report: "Mortgage lending in Poland, 2018-2020"