Banking volumes have continued to grow steadily during 2019 and Q1 2020. Deposits of non-financial clients at banks reached PLN 1.43 trillion after a 5% jump in Q1 2020 while client loans increased to PLN 1.26 trillion in Q1 2020, recording a 4% QoQ growth. The recent change in key volumes was balanced across all client segments. However, faster growth in deposits than in loans resulted in increasing liquidity within the sector. Total banking assets followed positive trends in client segments and they exceeded PLN 2.1 trillion as of March 2020.
In terms of profitability, banks operating in Poland recorded a 9% jump in bottom line to PLN 14.2 billion in 2019 or a 9% YoY growth. The ROAA* and ROAE* benchmarks improved by a fraction to 0.73% and 6.88% respectively, in 2019. Nevertheless, this highly favourable outlook has been reversed in Q1 2020 when the Monetary Policy Council (RPP) started a new easing cycle.
The dramatic shift in monetary policy in Q1 2020 combined with a weakening economy has created significant challenges to all banks operating in Poland. The series of interest rate cuts of 140 bp in Mar.-May 2020 alone is estimated to wipe ca. 33% of bank profits in 2020. Moreover, the predicted growth in regulatory charges, taxes and increased credit risk, will further cut into earnings. As a consequence, the bottom line of banks is likely to drop by over 50% in 2020 vs. the year before. This will be a major shock for banks as the over decade long period of stable profits has come to an end. Consequently missing profits will create a growth barrier for banks with thin equity buffers.
For more information on recent developments in the Polish banking sector, please refer to the full publication.
Table of contents
Slide 1: Executive summary
1. Macroeconomic overview Slide 2: Poland - General overview
Slide 3: Poland vs. other consumer markets in Europe, 2019
Slide 4: Key macroeconomic indicators, 2015-1Q2020
Slide 5: Foreign trade statistics, C/A balance, FDIs, 2015-2019
Slide 6: Unemployment, wages & salaries, 2015-2019
Slide 7: Disposable income in households, 2015-2019; income distribution 2018
Slide 8: Consumer confidence Index evolution, 2011-Apr.2020
Slide 9: Warsaw Stock Exchange - Turnover, Market cap and indexes, 2014-2019
2.1. Banking market - General trends Slide 10: CEE banking markets: Size vs. growth matrix, 2017-2019
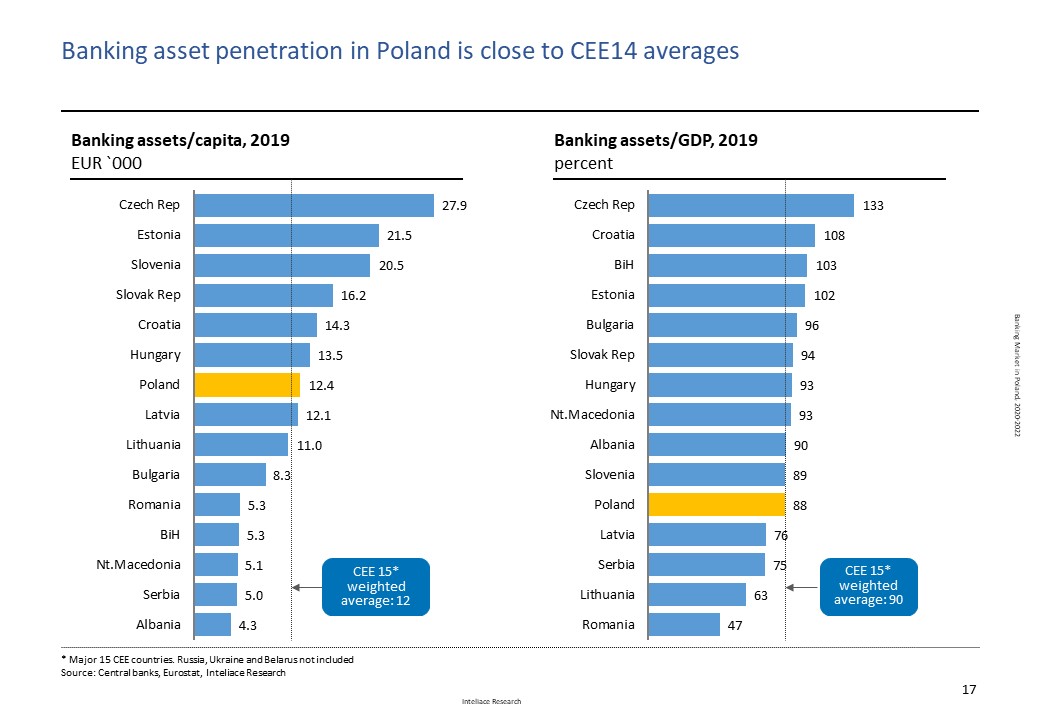
Slide 11: CEE banking penetration benchmarks - International comparison, 2019
Slide 12: Structure of the Polish Banking System, 2019
Slide 13: Evolution of banking assets by groups of owners (domestic/foreign), 2015-2019
Slide 14: Top 10 foreign investors in the Polish banking market, 2019
Slide 15: Banking assets evolution (LCU, EUR), 2015-1Q2020
Slide 16: Banking assets evolution by groups of banks, 2015-1Q2020
Slide 17: Top 10 commercial banks, market shares, ownership, 2019
Slide 18: Evolution of market shares for top commercial banks, 2016-2019
Slide 19: Concentration of the banking market, 2017 vs. 2019 (Assets, Branches, ATMs, HH Index)
Slide 20: Deposits of non-financial clients by segment, 2015-1Q2020
Slide 21: Loans to non-financial clients by segment, 2015-1Q2020
Slide 22: Deposits and loans of financial clients, 2015-1Q2020
Slide 23: Foreign funding evolution, 2015-1Q2020
Slide 24: Non-performing loans value and NPL ratios by type of business segment, 2017-Mar.2020
Slide 25: Non-performing retail loans, ratios by type of product, 2007-1Q2020
2.2. Banking market - Regulatory overview Slide 26: Regulatory overview: Regulatory bodies in the Polish banking market
Slide 27: Central Bank interest rates and mandatory reserve policy, Jan. 2017- May 2020
Slide 28: Inter-bank interest rates, Jan 2011 – April 2020: (WIBOR 3M, Polonia O/N)
Slide 29: Basel II/CRD implementation status, Capital requirement, own funds and CAR ratio for banks, 2014-2019
Slide 30: Bank outlets by type of bank, 2015-1Q2020
Slide 31: Employment in commercial banks, bank assets per employee evolution, 2015-1Q2020
Slide 32: Direct employee costs evolution, 2014-2019
Slide 33: ATM number and transaction value evolution 2014-2019, ATM players, May 2020
Slide 34: POS number and transaction value evolution 2014-2019, POS players, 2019 H1
3. Retail banking Slide 35: Demographic trends determining future number of bank clients, 2020-2030F
Slide 36: Cash in circulation, cash vs. deposits ratio, 2015-1Q2020
Slide 37: Household deposits evolution, split local vs. foreign currency, 2015-1Q2020
Slide 38: Household deposits by type (current vs term) and by client sub-segments, 2018-1Q20
Slide 39: TOP banks serving household sector, market shares, 2019
Slide 40: Current account penetration in Poland, Bank account holders demography, 2016
Slide 41: Bank account penetration gap: Poland vs. Europe, 2017/2018
Slide 42: Current accounts of individuals (ROR) at major banks, 2017-2019
Slide 43: Internet use and Internet users in Poland, 2019
Slide 44: Number of accounts with online access and number of online accounts actively used, 2014-2019
Slide 45: Top banks by number of active mobile app users, 1Q 2020
Slide 46: Key mobile payment services in Poland classified by origin of funds, 2019
Slide 47: Investment funds assets evolution, domestic and foreign funds, 2015-1Q2020
Slide 48: Investment funds - top 10 players, March 2020
Slide 49: Personal Financial Assets (PFA) structure and evolution, 2016-2019
Slide 50: Loans to household sector by type, evolution, 2015-1Q2020
Slide 51: Mortgage to household sector by currency- outstanding value, 2015-1Q2020
Slide 52: Mortgage to household sector – new sales, 2015-2019
Slide 53: Consumer lending outstanding evolution, 2015-1Q2020
Slide 54: Consumer lending – new loans, 2015-2019
Slide 55: Financial intermediaries: Value and number of loans sold, 2018
3.1. Payment cards Slide 56: Cards issued by type, 2014-2019
Slide 57: Cards payments: Poland vs. Europe, growth vs. market development stage, 2016-2018
Slide 58: Cards payments: International comparison, card payments value, volume, cards issued, 2018
Slide 59: Card transactions by type (cashless, cash), share of cash transactions, 2014-2019
Slide 60: Credit card transactions , values, volumes, per card evolution, 2014-2019
Slide 61: Top players in credit cards business, co-branding partners, 2019
4. Corporate banking Slide 62: Corporate subjects by size, number, employment, revenues and profits, 2018
Slide 63: Corporate subjects, revenue and profit evolution, 2014-2019
Slide 64: Number of firms by turnover (with 10+ employees), 2019
Slide 65: Corporate subjects, regional distribution, 2019
Slide 66: Corporate deposits and loans evolution, 2015-1Q2020
Slide 67: Top players in the corporate banking market, market shares in deposits and loans, 2019
Slide 68: Brokerage business, top players, shares of investors groups, 2014-2019
Slide 69: Leasing market, structure by industry, top players, 2014-2019
Slide 70: Factoring market, top players, 2014-2019
Slide 71: Non-treasury debt securities market, 2015-2019
5. Banks' profitability Slide 72: Nominal rates on loans and deposits by segment, implied interest margins, Jan. 2017-Mar.2020
Slide 73: Commercial banks - profitability tree, 2016-2019
Slide 74: Top 5 commercial banks profitability tree – peers comparison, 2019 (PKO, Pekao, Santander, mBank, ING)
Slide 75: Segment reporting (1/2): volumes, revenues and profit by segment (retail, corporate, other), 2019
Slide 76: Segment reporting (2/2): volumes, revenues and profit by segment (retail, corporate, other), 2019
Slide 77: Commercial banks - revenue, costs and profits composition, 2019
Slide 78: Impact of 140bp rate cuts of Mar-May 2020 on the bottom line as expected by major banks in Poland (in 2020)
6. Banks' valuation and M&A activity Slide 79: Share price performance in the stock market for key listed banks in Poland, Jan. 2017– May. 2020
Slide 80: Market multiples for major listed banks in Poland, May 2020
Slide 81: Strategic control map for major listed banks in Poland, May 2020
Slide 82: Efficiency of top banks in Poland - Cost to income, Assets/Personnel/Branches benchmarks, 2019
Slide 83: Acquisition transactions in the Polish banking market (1/4), 2005-2008
Slide 84: Acquisition transactions in the Polish banking market (2/4), 2009-2011
Slide 85: Acquisition transactions in the Polish banking market (3/4), 2012-2016
Slide 86: Acquisition transactions in the Polish banking market (4/4), 2017-2020
Slide 87: New entrants, 2014-2017
7. Top 5 banks - Profiles Slide 88-89: Bank profiles: PKO Bank Polski
Slide 90-91: Bank profiles: Bank Pekao
Slide 92-93: Bank profiles: Santander
Slide 94-95: Bank profiles: mBank
Slide 96-97: Bank profiles: ING Bank
8. Mid-term forecasts Slide 98: Forecast - household loans & deposits, 2020-2022F
Slide 99: Forecast - corporate loans & deposits, 2020-2022F
Slide 100: Forecast - banking assets, 2020-2022F
9. Notes on methodology
 Research Report: "Banking Market in Poland, 2020-2022"